Gapminder World
Audience: High School
Gapminder World is a great way to bring the world of statistics to life in your classroom. For instance Gapminder
World graphs the average income per person by life expectancy to show how they are related over time. Or imagine you are teaching a unit on global pollution. You could use Gapminder World to show how different countries have lead in CO2 emissions since 1820 to the present. Maybe you have been talking about natural disasters; Gapminder World will plot what countries have been affected and how many deaths occurred in any given year.
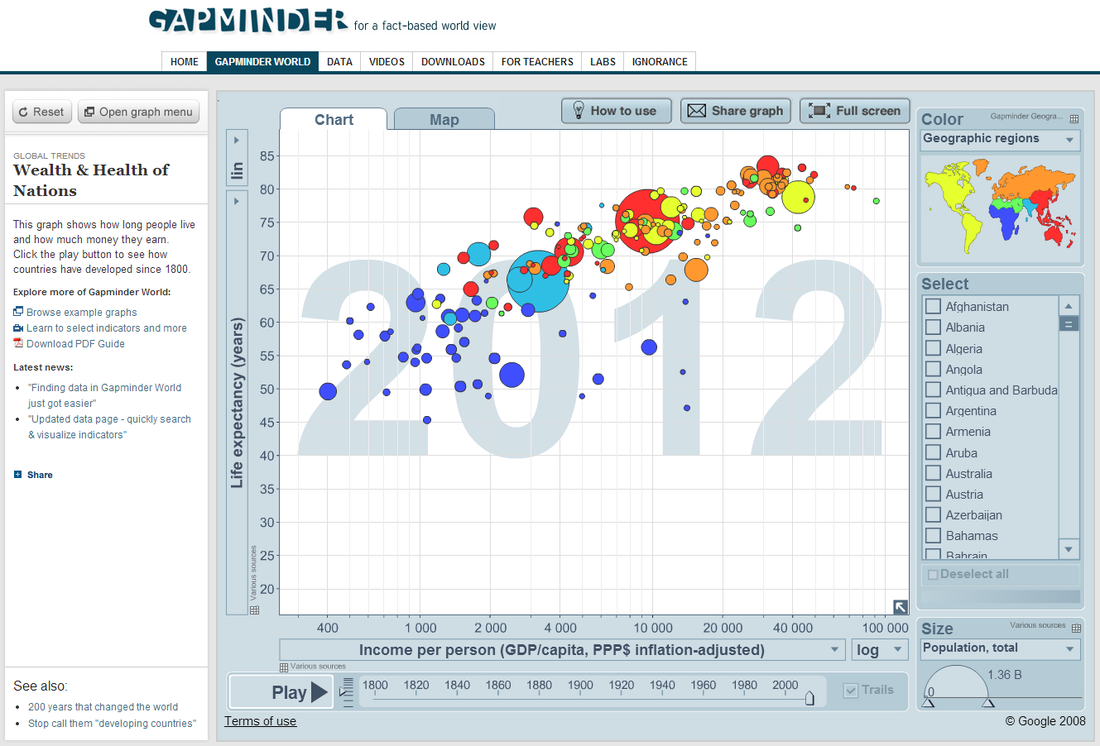
Click on image to go to site