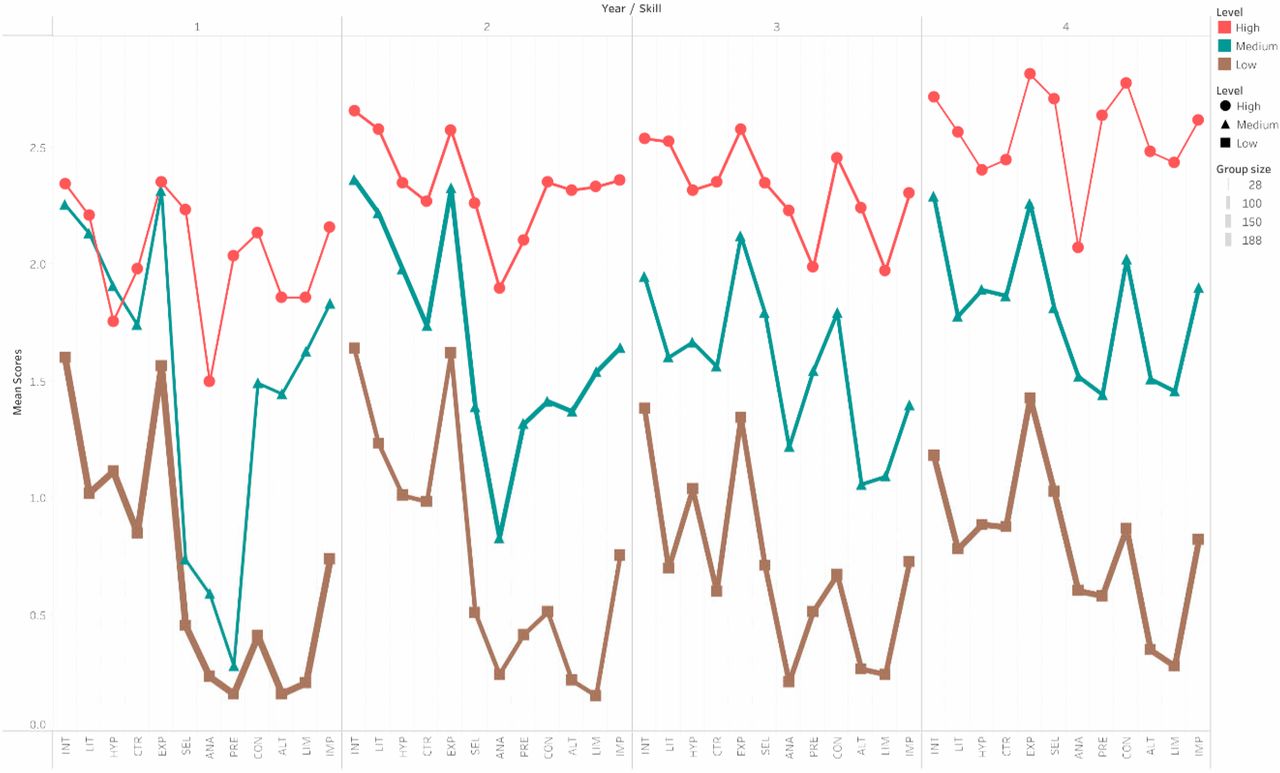
The above figure is from the publication Postdocs’ Lab Engagement Predicts Trajectories of Ph.D. Students’ Skill Development. Using writing samples which reported studies, written by participants, research skills were measured (introducing the context of the study (INT), integrating literature appropriately (LIT), establishing testable hypotheses (HYP), appropriate controls and replication (CTR), experimental design (EXP), appropriately selecting data for analysis (SEL), data analysis itself (ANA), presentation of results (PRE), basing conclusions on results (CON), alternate explanations of findings (ALT), limitations of the study (LIM), and implications of the findings (IMP), all of which can be seen in the figure above). Using the measurements of the above skills, high, medium, and low skill growth groups were found. The above figure illustrates these three latent subgroups and their growth through time. To learn more about how these subgroups are affected by their doctoral training, read the article above.

The above figure is from the publication Identifying Faculty and Peer Interaction Patterns of First-Year Biology Doctoral Students: A Latent Class Analysis which examined how different demographics interact with their peers and faculty advisors, specifically within doctoral programs. The article also outlines the percieved effects that this socialization has on various academic and research outcomes. For more information, read the article above.
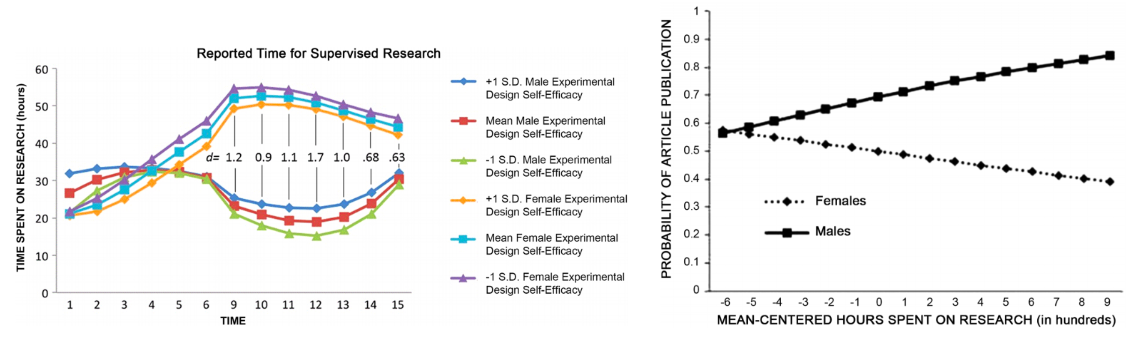
The above figures are from the publication Time-to-Credit Gender Inequities of First-Year PhD Students in the Biological Sciences which examined graduate student's research hours logged and the authorship claimed by the said research students with reference to their gender. The graph on the left shows the changes in time spent on research by gender across time. The graph on the right shows the probability of article publication based on research hours, separated by gender. For more information, read the article above.